


 5 / 11

4
August 2015
2014 M&A Summary Transaction Analysis
Transaction
Activity
Summary
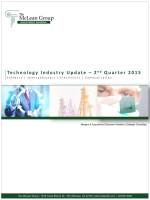
Summary of Transaction Activity
In the last twelve months, M&A activity increased by 16.1% to 3,795 transactions from 3,268 in the second
quarter of 2014, an increase of 527 transactions year-over-year. The three most active sectors from Q2 of 2014
to Q2 of 2015 were Application Software, Internet Content and Commerce, and IT Services and Distribution,
which represented 55% of all transactions. After a slight decrease in 2014’s Q4, transaction activity has
increased in the first two quarters of 2015, which ended with 960 transactions. Heading into the last two
quarters of 2015, the sectors with the greatest increase in activity were Mobility, Hosted Services, and Internet
Content and Commerce, increasing by 45.0%, 35.0%, and 32.0%, respectively in Q2 2015 over Q2 2014.
Transaction Activity by Quarter
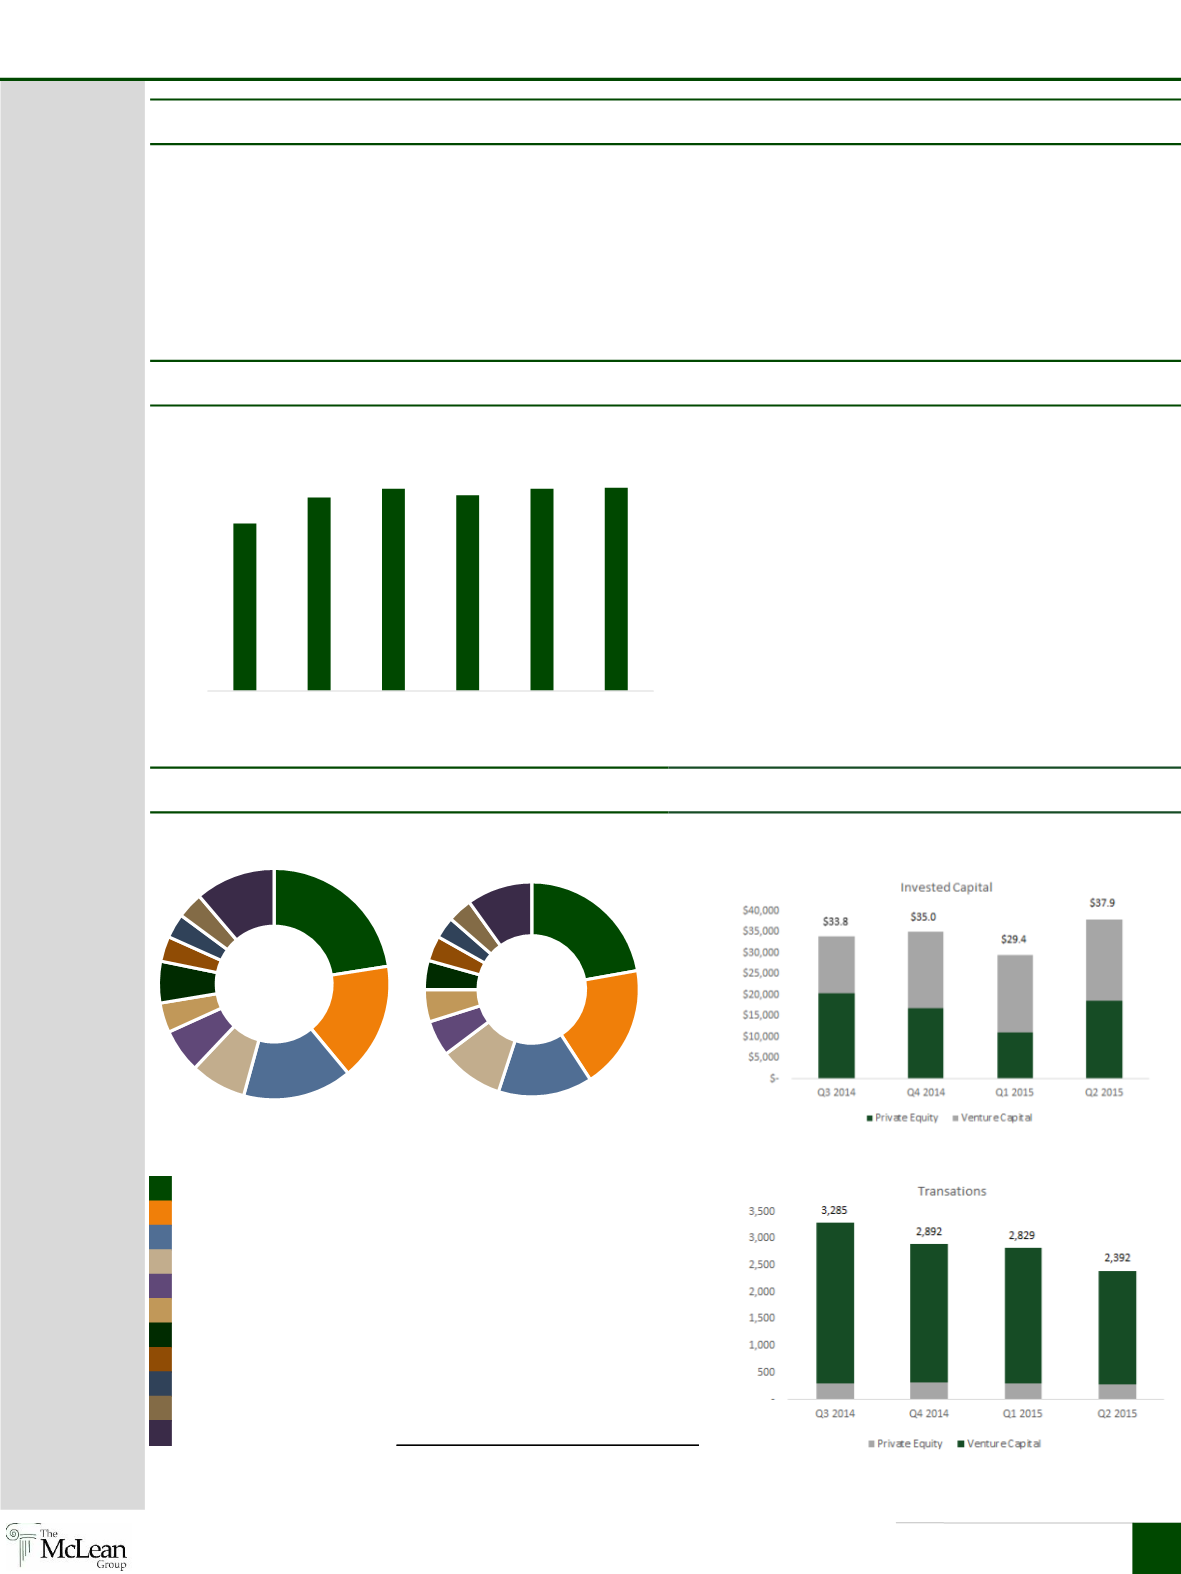
Financial Buyer Summary
In the last twelve months, The McLean Group tracked
11,398 technology-related transactions by Private
Equity (PE) and Venture Capital (VC) firms, which is a
21% increase over transaction activity in 2014. The
amount of invested capital increased by 0.4% from
$134.1 billion to $136.3 billion. While the majority of
transactions were from VC firms in Q2 2015 (88.5%),
the amount of capital invested by both PE (49.0%) and
VC (51.0%) firms were almost equivalent. As
expected, VC firms invested more frequently in
technology firms; however at much smaller dollar
amounts than their PE counterparts.
Transaction Activity by Sub-Sector
Financial Buyer Activity
As of: 06/30/2015
Sources: 451 Research and PitchBook
793
913
954
923
958
960
-
200
400
600
800
1,000
1,200
Q1 2014 Q2 2014 Q3 2014 Q4 2014 Q1 2015 Q2 2015
23%
16%
15%
8%
6%
4%
6%
4%
3%
4%
11%
LTM Q2 2014
22%
19%
14%
10%
5%
5%
4%
4%
3%
4%
10%
LTM Q2 2015
LTM Q2 2014 LTM Q2 2015 %Change
Application Software
736
842
14%
Internet Content and Commerce
538
708
32%
IT Services & Distribution
499
538
8%
Mobility
255
369
45%
Information Management
201
204
1%
Hosted Services
136
184
35%
Systems
190
167
-12%
Security
115
144
25%
Communication Services
112
123
10%
Semiconductors
119
141
18%
Other
367
375
2%
Total
3,268
3,795
16.1%