
17
2014 Year in Review
Dry Powder Calculations
(Aerospace)
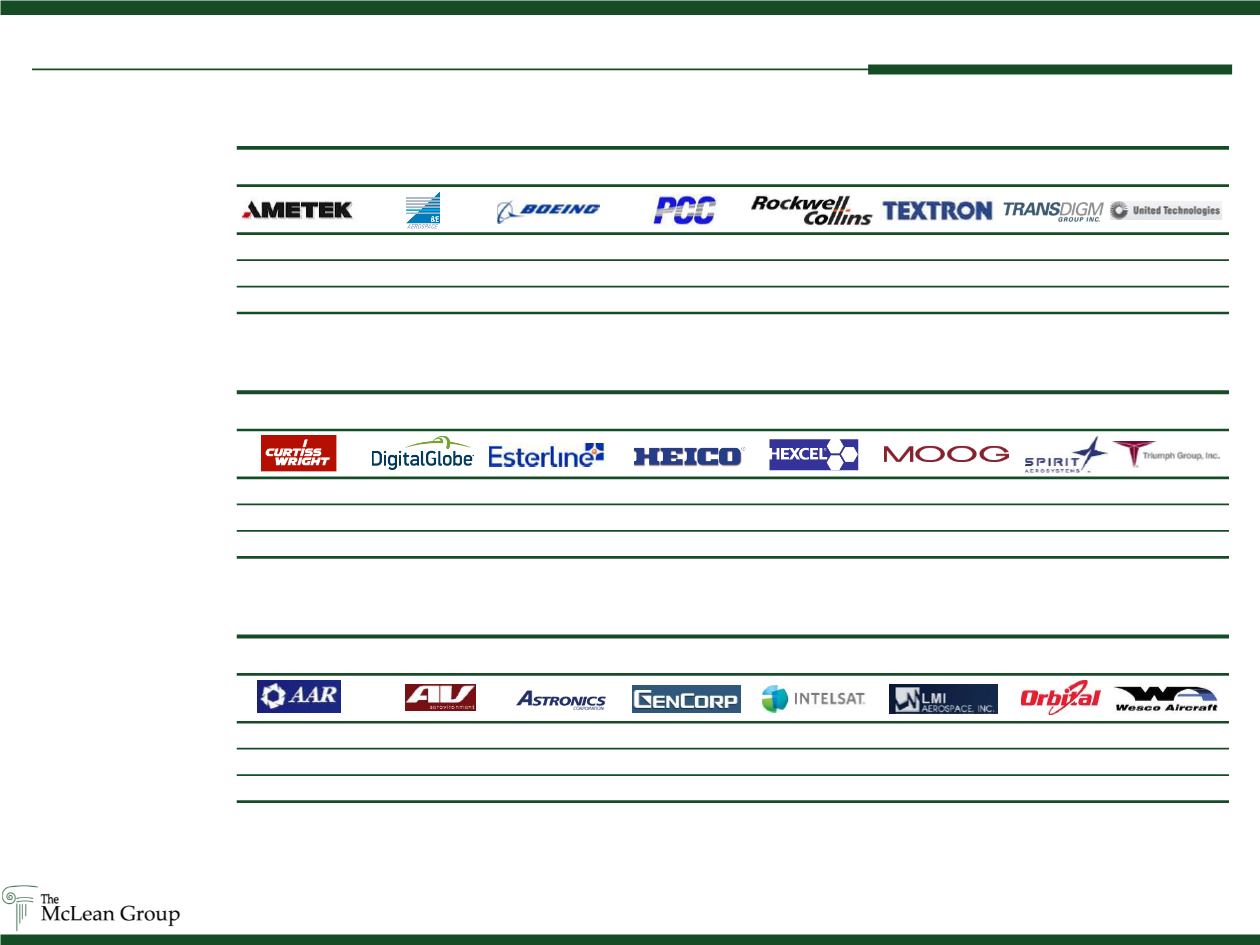
Mid Cap Aerospace Index
3x LTM EBITDA
$1,198.0
$915.6
$1,103.3
$798.4
$1,131.0
$1,062.5
$1,347.9
$1,290.2
Less LT Debt
959.0
1,138.9
622.5
329.1
416.3
951.6
1,156.6
1,442.7
Plus Cash
222.5
127.4
238.1
20.2
70.9
240.2
452.8
34.2
Dry Powder
$461.5
($95.9)
$719.0
$489.6
$785.6
$351.2
$644.1
($118.3)
Small Cap Aerospace Index
3x LTM EBITDA
$610.8
$46.4
$378.2
$424.5
$5,917.6
$129.3
$462.0
$616.0
Less LT Debt
635.3
0.0
212.6
782.2
15,454.0
272.7
136.9
1,106.8
Plus Cash
92.6
126.3
24.9
265.9
656.0
2.5
427.5
104.8
Dry Powder
$68.1
$172.7
$190.5
($91.8)
($8,880.4)
($140.9)
$752.7
($386.1)
Large Cap Aerospace Index
3x LTM EBITDA
$3,107.0
$1,573.2
$27,306.0
$9,456.0
$3,477.0
$4,725.0
$3,215.1
$35,028.0
Less LT Debt
1,714.0
2,429.7
9,070.0
4,320.0
2,501.0
4,116.0
7,515.3
19,794.0
Plus Cash
377.6
292.5
11,733.0
0.0
315.0
731.0
1,011.6
5,235.0
Dry Powder
$1,770.5
($564.0)
$29,969.0
$5,136.0
$1,291.0
$1,340.0 ($3,288.6)
$20,469.0
($ millions)
Source: Public Filings; Capital IQ as of 1/30/15


