


 11 / 30

10
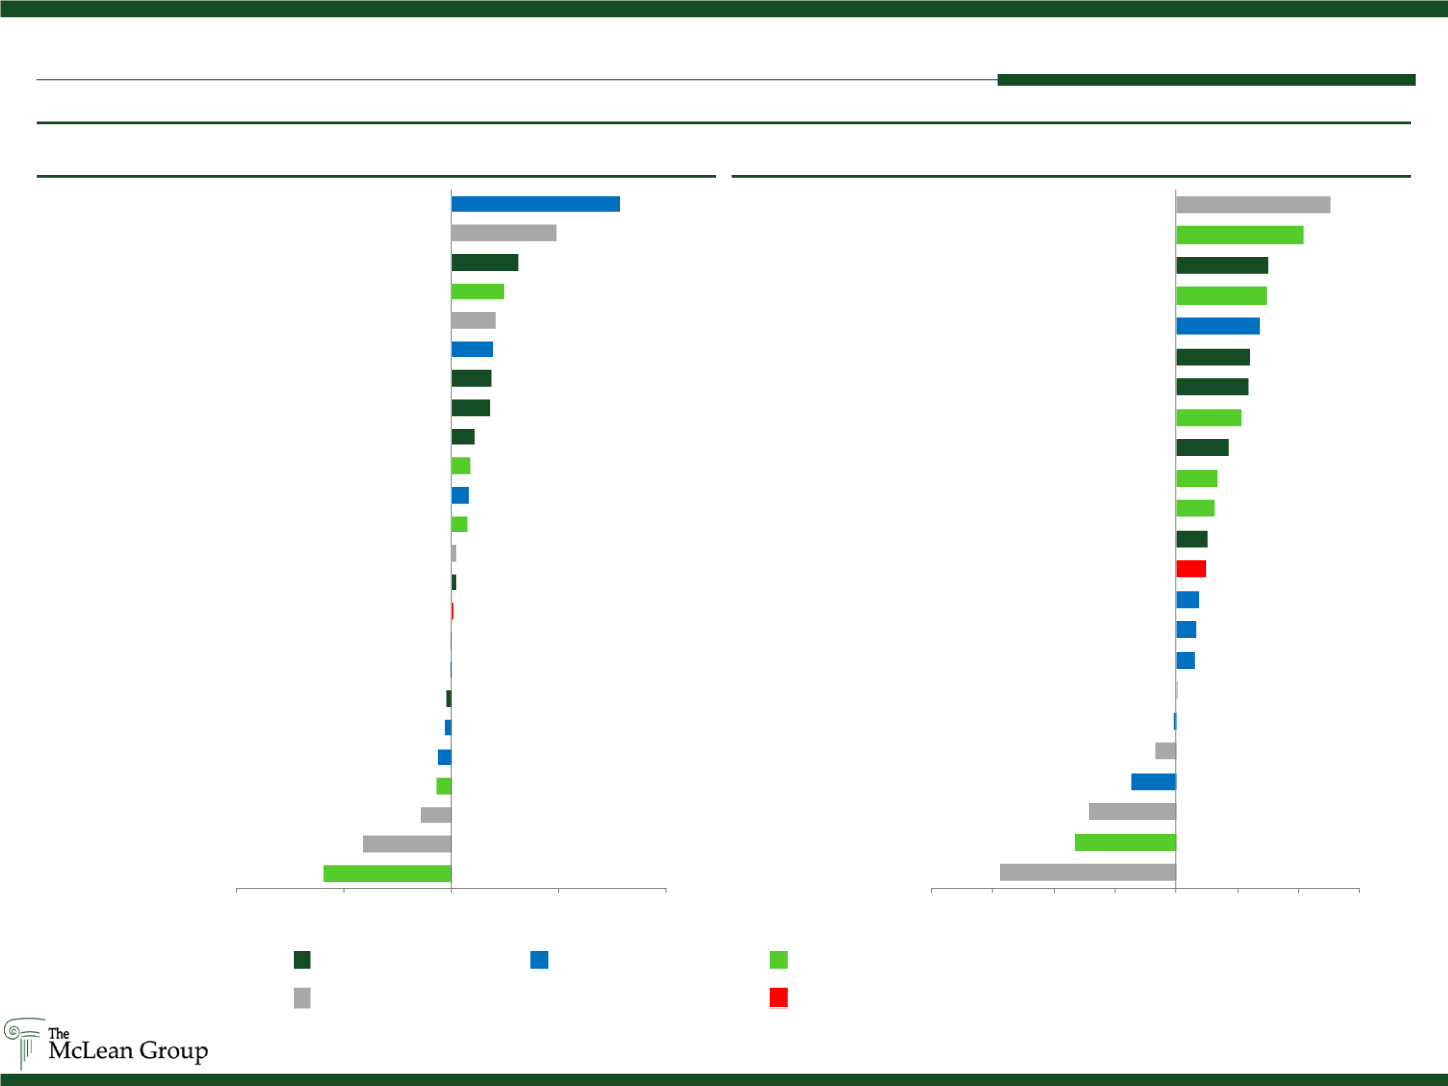
First Quarter 2015
-29.8%
-20.7%
-7.0%
-3.6%
-3.2%
-1.7%
-1.4%
-0.3%
-0.3%
0.4%
1.0%
1.2%
3.7%
3.9%
4.3%
5.4%
9.1%
9.2%
9.7%
10.2%
12.3%
15.5%
24.2%
39.0%
(50%)
(25%)
0%
25%
50%
Engility
KEYW
Vectrus
Leidos
Flir
Cubic
General Dynamics
L-3
ICF
S&P 500
Raytheon
NCI
SAIC
Teledyne
CACI
Lockheed Martin
Booz
Northrop Grumman
Harris
Kratos
ManTech
Boeing
VSE
Exelis
First Quarter 2015
(57.7%)
(33.3%)
(28.6%)
(14.8%)
(6.9%)
(0.9%)
0.5%
5.9%
6.7%
7.7%
9.7%
8.8%
12.6%
13.3%
17.1%
21.4%
23.8%
24.0%
27.5%
29.7%
29.9%
41.4%
50.2%
(80%) (60%) (40%) (20%)
0% 20% 40% 60%
KEYW
Engility
Kratos
Flir
NCI
Cubic
ICF
L-3
Harris
Teledyne
S&P 500
Raytheon
ManTech
Leidos
Boeing
CACI
General Dynamics
Lockheed Martin
Exelis
Booz
Northrop Grumman
SAIC
VSE
Last 52 Weeks
Defense Prime Index
Defense Systems Index Diversified Government Services Index
Middle Market Government Services Index
S&P 500 Index
Capital Markets: Stock Performance
(Defense and Gov. Services)
Source: Public Filings; Capital IQ as of 03/31/15