


 6 / 30

5
First Quarter 2015
GD
Raytheon
Lockheed
Teledyne
Harris
Northrop
L-3
Booz
CACI
Engility
KEYW
FLIR
NCIT
ManTech
ICF
Exelis
Kratos
Cubic
VSE
Boeing
SAIC
Vectrus
Leidos
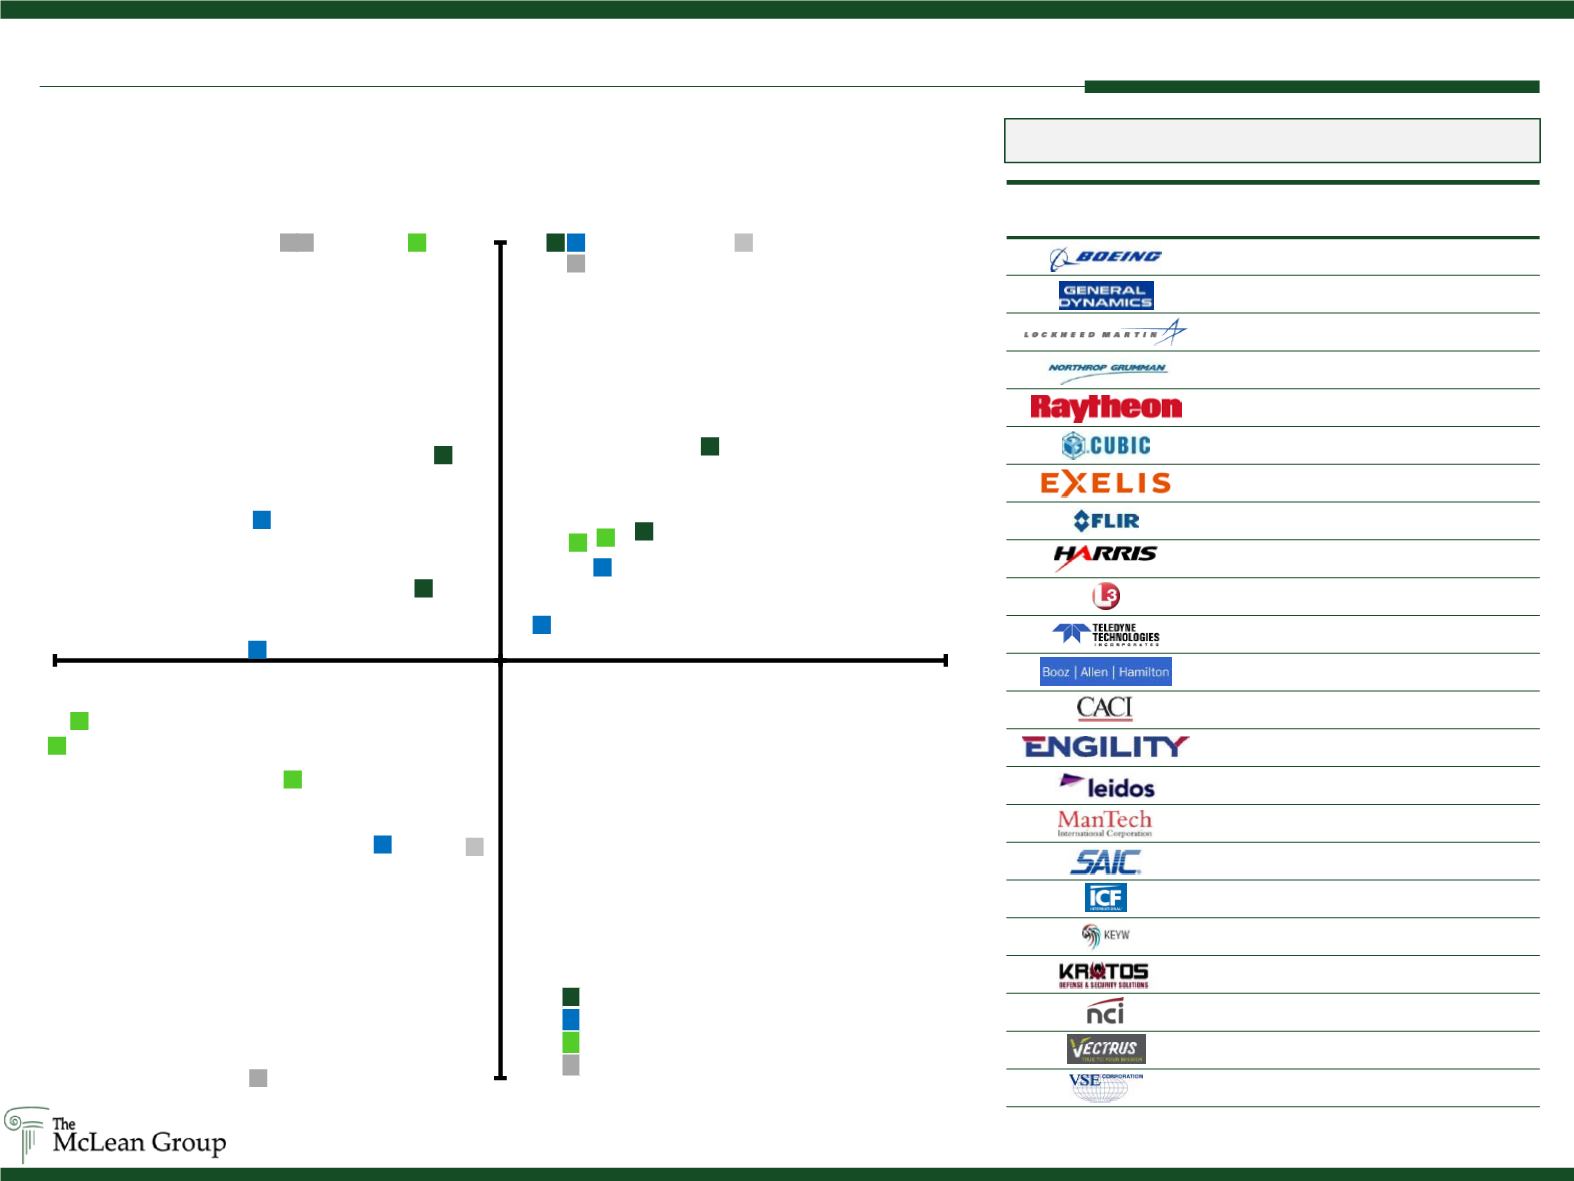
-20.0%
20.0%
-10.0%
10.0%
EPS
Revenue
Defense Prime Index
Defense Systems Index
Diversified Government Services Index
Middle Market Government Services Index
Company
Quarter
Ending
Revenue EPS
3/31/15
-1.7%
3.4%
4/5/15
4.7%
10.2%
3/29/15
-1.3%
9.8%
3/31/15
3.2%
6.2%
3/29/15
1.2%
28.0%
9/30/14
1.5%
29.8%
12/31/14
2.3%
4.4%
3/31/15
-5.4%
6.7%
4/3/15
0.9%
1.7%
3/27/15
-2.6%
-8.8%
3/29/15
-5.5%
0.5%
12/31/14
2.4%
5.9%
3/31/15
-4.7%
-5.7%
12/31/14
-9.5%
-2.9%
1/30/15
-1.7%
43.8%
3/31/15
-10.0%
-4.1%
1/30/15
1.7%
5.6%
12/31/14
-0.6%
-8.9%
12/31/14
-4.7% 116.7%
12/28/14
-4.4%
57.1%
3/31/15
1.5%
20.0%
12/31/14
5.5%
26.9%
12/31/14
-5.4% -22.6%
Most Recent Quarterly Financial Results
(Defense and Gov. Services)
Most Recent Quarterly Earnings Surprise
1
Source: Public Filings; Capital IQ as of 05/01/15
Most Recent Quarterly Earnings Surprise
1
1
Earnings Surprise is calculated as the difference of a Company’s most recent
quarterly financial results from Capital IQ analyst consensus estimates