
2023 Water & Wastewater Year in Review
Market Performance & Trends | 2024 Outlook | Transaction Activity
Download Full Report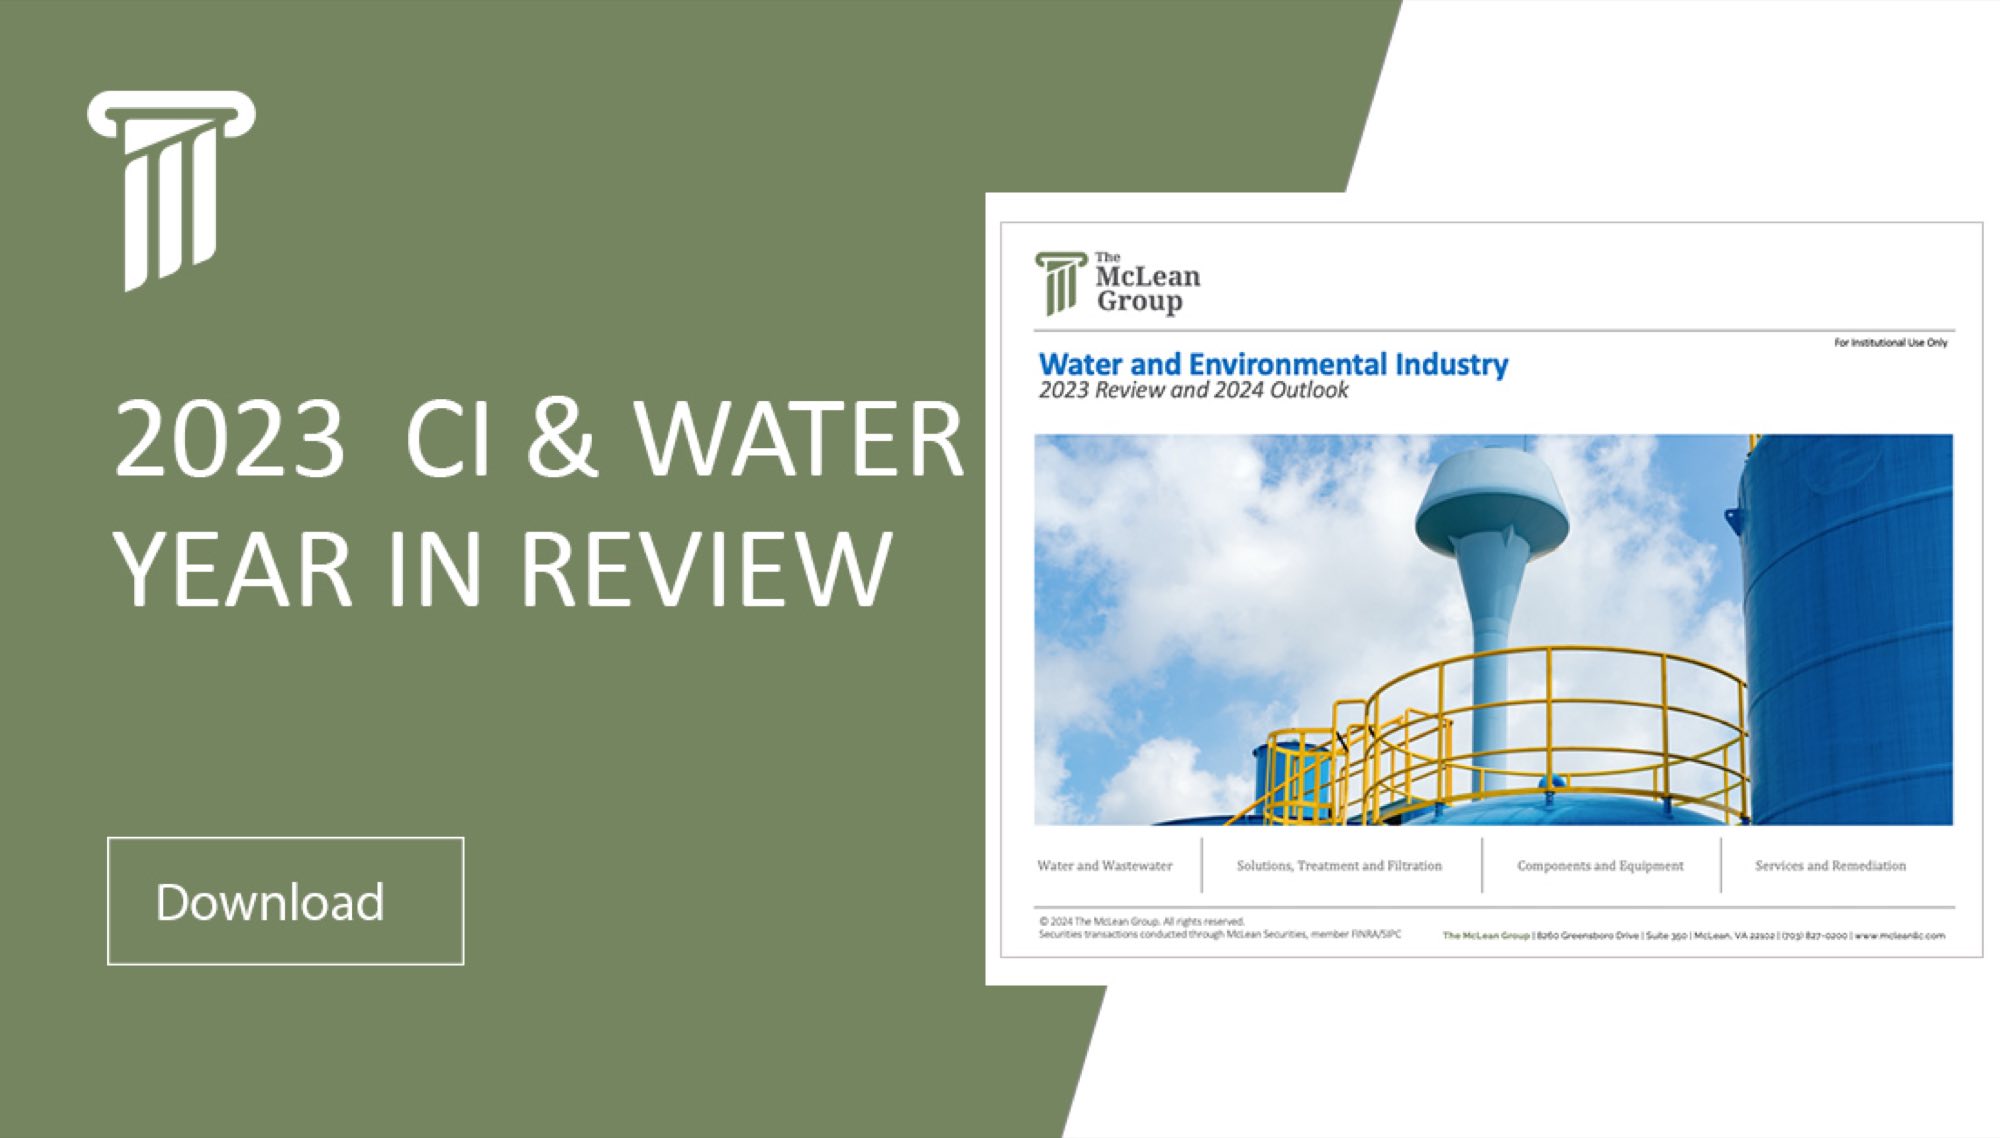
Year in Review
Water Industry Recap for 2023
- The year 2023 was generally quite positive in terms of improved financial performance by water-related companies as they navigated the challenges in 2022 related to COVID-19 and associated supply chain disruptions. The last remaining vestiges of compressed margin projects especially in the long sales processes of the municipal water segment are being weaned from backlog resulting in improved business performance.
- This past year witnessed continued advancement in numerous areas of interest for the industry. These include proposed PFAs regulations, business models incorporating “water-as-a-service”, increased water infrastructure investment, ongoing digitization implementation across the water sector, and funding for lead service line replacements (LSLs in the U.S. and select M&A transactions that continue to shape the water market).
- Other investment areas being pursued by both strategic and financial investors include addressing emerging contaminants (eg. Microplastics, PFAs detection/removal/destruction), nutrient removal/reuse, and the ongoing implementation of a vast array of digital solutions to optimize system performance.
- We expect ongoing interest in these key areas of focus and other noted investment areas well into 2024 and beyond. Overall strong interest by institutional investors eager to participate in the robust global water economy supported by strong market tailwinds.
Historic Infrastructure Funding
- The EPA completed its 2023 Drinking Water Infrastructure Needs Survey and Assessment, encompassing the capital needs of all 50 states and U.S. territories, including over 100,000 individual planned municipal investments.
- The assessment highlighted a total planned investment in U.S. drinking water infrastructure over the next 20 years of roughly $625 billion. Further analysis of the survey breaks down the number into subsectors where money will be directed: Water Networks 58.6%, Drinking Water Treatment 17.1%, Water Resources 12.8%, Pump Stations 8.7% and Other 2.8%.
Emergence of “Water-as-a-Service”
- Increasing regulation of wastewater discharge has led many companies to create inventive ways to service new industrial and municipal customers subject to rapidly evolving regulations.
- The rate of regulatory change and the capital investment required to meet discharge limits has led many customers to outsource ownership of filtration equipment, paying for throughput on an as needed basis. Called “Water as a Service” (WaaS), outsourcing allows customers to focus on their core competencies while receiving highly customized filtration services without having to invest in new equipment that may become obsolete in the face of new discharge limits. WaaS often includes the integration of monitoring systems and data tools to optimize system performance.
Resource Recovery – Shifting to a Circular Economy
- The influx of money to the municipal water industry and greater focus on resource recovery caused by heighted discharge regulations has led to a shift in the industry to capture the “value of waste” by recovering key nutrients and energy of water treatment byproducts.
- The growing emphasis on circular economies creates a new revenue stream for municipal treatment facilities with onsite cogeneration while also offloading byproducts to industrial partners. Circularity not only benefits municipalities but also their equipment suppliers and operating partners who are increasingly being tapped to handle more complex challenges including solids handling, dewatering, storage, and destruction/reuse.
Race to Replace Lead Service Lines
- The EPA updated its Lead and Copper Revisions to give U.S. utilities just 10 years to replace 9 million lead service lines. The new guidelines require utilities to reduce the number of lead service lines by 10% each year and distribute point of use filters if testing exceeds a certain threshold of lead.
- The EPA estimates that the approximately 9 million lead services lines will cost $5,000 to $5,500 per line to replace for a total cost of $46 billion. This exceeds the $15 billion allocated for lead pipe replacement by the Infrastructure Investment and Jobs Act, even after including another $11.7 billion injected into state revolver funds.
Market Performance & Trends
Water Sectors vs The Market, 2023: Infrastructure +30.2%, Components +26.4%, S&P 500 +24.7%, System Solutions -3.7% and Water Utilities -16.1%.
TMG’s indices closely tracked the S&P 500 throughout 2023 with Infrastructure and Components both outperforming the benchmark.
Infrastructure continues to benefit from historic government investment while component providers were insulated from the worst of inflation due to their decreased reliance on capital expenditures and ability to pass cost increases on to customers faster due to shorter project lifecycles.
Utilities and System Solutions lagged the S&P as margins were more negatively impacted than their peers due to their longer project lifecycles an inability to expeditiously pass through costs to end customer as input costs rose.
Since the start of 2021, construction spending on water supply has increased by about 50%, increasing revenue and backlogs across the industry.
Throughout 2022, the cost of construction materials outpaced water construction, creating margin compression in the industry.
This trend reversed in 2023, resulting in increased industry profitability.
Inflation of input costs not only had a major impact on members of the industry constructing treatment facilities, but also those supplying equipment for their operation.
One significant component of treatment equipment, stainless steel, experienced a dramatic cost increase in 2021 and 2022, reducing margins for those unable to pass through costs. Like construction materials, this trend reversed in 2023, creating margin expansion in the industry.
Another significant input cost for industry members, water treatment chemicals, experienced significant cost increases throughout 2021.
Unlike stainless steel, costs have remained at elevated levels, potentially signaling a new norm and forcing industry member to adjust cost/pricing models to avoid margin compression.
EBITDA Valuation Multiples
Source: S&P CapIQ. Multiples are as printed in the report (LTM, 2022E and 2023E EV/EBITDA by TMG water index) and are provided for reference only. Size and liquidity discounts are required for comparison with private companies.
2024 Outlook
The Global Water & Wastewater treatment market is expecting to see aggressive growth in coming years with a forecasted 7.1% CAGR for the period 2021-2029, from $282B in 2021 to $488B in 2029.
This growth is justified by globally increasing urban populations, standards of living, water scarcity, and government regulation.
The defensive nature of the industry has allowed access to capital and profits to remain steady in the recent pandemic driven economic downturn.
Innovative technologies and diverse market segmentation fosters competition in the industry, providing ample opportunity for strategic acquisitions.
Municipal wastewater applications continue to dominate the market (66% municipal, 34% industrial) particularly in emerging economies like China, India, and Brazil.
This is attributable to increasing urban populations and government policy's supporting infrastructure development.
Industrial applications are anticipated to experience the faster growth of the two with a forecasted 5.3% CAGR for the period 2021-2029.
This growth will be driven by more global manufacturing, new technologies requiring treated water, and rising environmental consciousness.
Water industry subsectors, 2023 market size (3-year CAGR): Water Treatment Services & Technologies $60B (6.2%), Water Treatment Chemicals $37B (3.2%), Point of Use Systems $19B (9.3%), Water Recycle and Reuse $16B (10.8%), Industrial Treatment Chemicals $14B (5.3%), Biological Water Treatment $10B (5.1%), Ultrapure Water $9B (8.6%), Membranes $8B (9.7%) and RO Membranes $4B (10.0%).
While 2023 witnessed a decline in M&A activity in the water sector, the Federal Reserve is expected to lower interest rates in 2024, reducing the cost of capital for buyers and risk profile for lenders which will finance deals not economically feasible in 2023.
The lower interested rates and inflation expected in 2024 will also improve the economics of projects, particularly capital-intensive municipal builds/upgrades. The improved risk profile of projects is expected to attract new bidders and increase competition in the space.
As inflation eased through 2023, input costs decreased, and margins improved across the water industry which increased cash reserves. In 2024, expect an increase in deal activity from strategics looking to deploy recently recovered cash reserves.
High borrowing costs in 2023 led many acquirers to reduced the amount of debt leveraged to finance transaction. Expect this trend to reverse in 2024 as interest rates decrease and buyers look to refinance previous “cash heavy” transactions.
Both financial sponsors and strategic acquirers continue to focus attention on high growth markets largely driven by emerging regulations. Expect emerging/high growth markets including PFAS destruction and lead service line replacement to continue to drive M&A activity in 2024.
Buyers will continue to seek businesses with recurring revenue due to their faster cash conversion cycles, lower capital expenditure requirements, and reduced customer concentration. Oftentimes service or digital based, such companies will continue to command a premium.
Transaction Activity
Water M&A deals by quarter: 2020: 367 deals; 2021: 392 deals; 2022: 311 deals; 2023: 219 deals (Q1 54, Q2 65, Q3 50, Q4 50).
2023 continued the previous year’s declining trend in acquisition activity as interest rates held steady, increasing the cost of capital for both strategic and financial sponsors. Acquisition activity from strategics witnessed a particular downturn, as persistent inflation throughout the year increased input costs, weighing on profitability and available cash for acquisitions.
2023 top acquirers, strategic: American Water (12), DXP (4), Culligan (3), Hawkins (2), Middleby (2) and Aliaxis (2). Financial: New Mountain Capital (8), Frontenac (8), BGF (5), XPV (4), Littlejohn & Co. (3) and Sciens Water (3). Culligan, XPV and Sciens Water are former TMG deal partners.
Transactions by Quarter
Select 2023 Transactions
Dates are closing dates. Source: S&P CapIQ. EV and EBITDA multiple shown where disclosed.
Read the 2023 Year in Review
- Apr 2024Q1 2024 Mergers & Acquisitions Market Update
- Mar 2024Monthly Middle Market M&A Insider Report (February 2024)
- Feb 2024Monthly Middle Market M&A Insider Report (January 2024)
- Aug 2023Q3 2023 Mergers & Acquisitions Market Update
- Jul 2023Q2 2023 Mergers & Acquisitions Market Update
- Jul 2023Monthly Middle Market M&A Insider Report (August 2023)
Browse every 2024 post in the archive →Planning a sale or acquisition? See our M&A advisory and valuation services.
Speak With the Team
Download the Full 2023 Year in Review
Complete deal tables, valuation multiples, public company comps, and contract awards across all four sectors.
The information provided in this newsletter is for informational purposes only and does not constitute an offer to sell or the solicitation of an offer to buy any of the securities mentioned herein. Past performance does not guarantee future results. None of the information or analyses presented are intended to form the basis for any investment decision, and no specific recommendations are intended. Any performance mentioned does not include transaction fees and costs, which would reduce an investor's return. An investment cannot be made directly in these custom market indices. Public market valuation multiples are provided for reference purposes only and reflect traded equity values, which may differ materially from private company transaction pricing.
The logos and company names used in this report are for illustration purposes only, and the report is not associated with or supported by the owners of the trademarks.
© 2026 The McLean Group. All rights reserved. Securities transactions are conducted through McLean Securities, LLC, a member of FINRA/SIPC.