


 7 / 29

6
Second Quarter 2015
Company
Quarter
Ending
Revenue EPS
3/31/2015
-4.5%
0.5%
6/30/2015
1.3%
18.2%
6/28/2015
-4.0%
-4.3%
6/30/2015
-3.0%
2.3%
7/2/2015
-1.2%
12.4%
7/4/2015
-5.2%
1.7%
3/28/2015
-2.0%
5.0%
6/30/2015
-1.2%
5.8%
6/30/2015
-0.6%
-1.3%
6/30/2015
-2.0%
2.5%
5/1/2015
-6.5%
-9.8%
4/30/2015
-3.3%
8.9%
6/30/2015
-2.1%
3.3%
7/4/2015
0.6%
5.5%
3/31/2014
-1.8%
6.5%
6/30/2015
-0.4%
-2.2%
5/31/2015
-1.4% -1160.0%
4/30/2015
0.9%
77.8%
4/4/2015
-5.9%
-34.7%
6/30/2015
2.9%
-550.0%
6/30/2015
1.3%
84.2%
3/31/2015
2.8%
-58.3%
3/31/2015
-3.8%
-6.5%
3/31/2014
-1.8%
6.5%
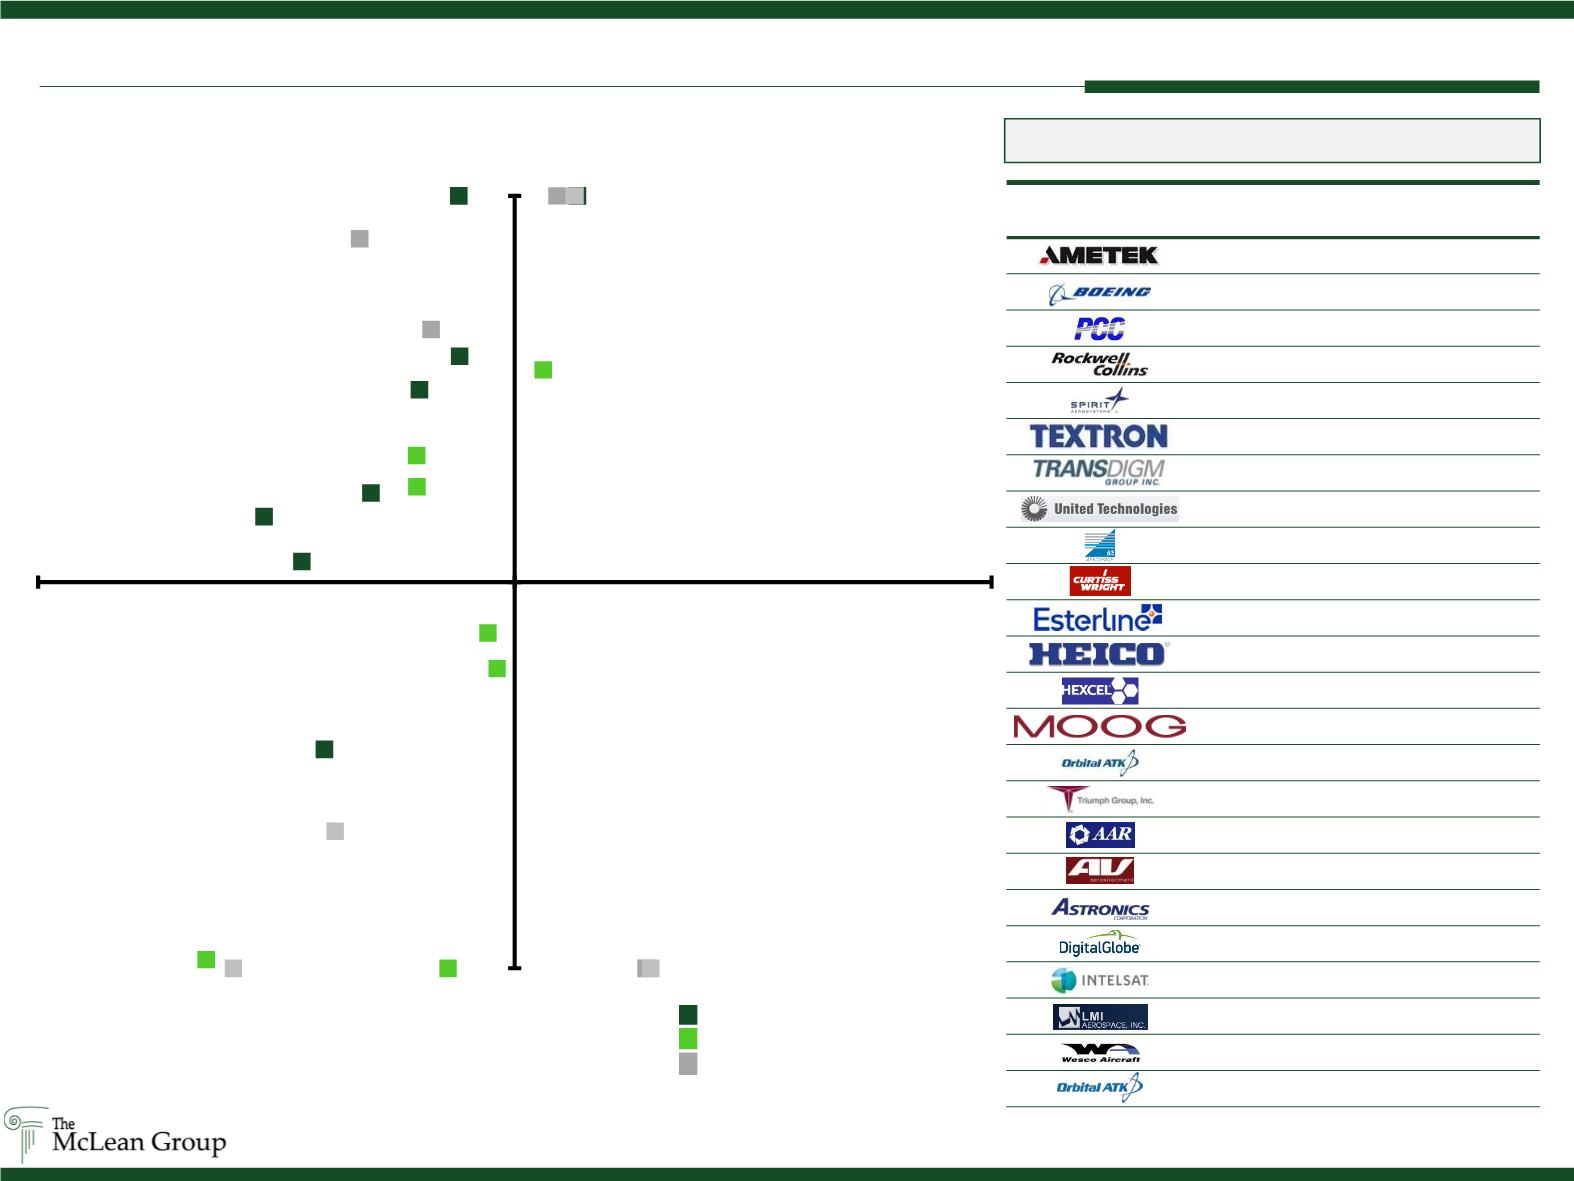
Most Recent Quarterly Financial Results
(US Aerospace)
Most Recent Quarterly Earnings Surprise
1
Most Recent Quarterly Earnings Surprise
1
1
Earnings Surprise is calculated as the difference of a Company’s most recent
quarterly financial results from Capital IQ analyst consensus estimates
Large Cap Aerospace Index
Mid Cap Aerospace Index
Small Cap Aerospace Index
Source: Public Filings; Capital IQ as of 07/31/15
Precision Castparts
Boeing
AeroVironment
Hexcel
Spirit
B/E Aerospace
Triumph
Astronics
LMI Aerospace
Rockwell Collins
HEICO
Wesco
UTC
Ametek
Esterline
AAR
Curtis Wright
Textron
TransDigm
Moog
Digital Globe
Intelsat
Orbital ATK
-10.0%
10.0%
-10.0%
10.0%
EPS
Revenue